
CVE statistics for 2026: each doubling came faster
I counted the CVEs published each month in the official list. Each doubled level came faster than the last: 12 years, 7 years, 2 years, then 5 months. Why the count is rising, what it doesn't mean, and how to decide what to patch first.
I counted the CVEs published each month in the official CVE list. Then I marked the first month above 750, then above each doubled level. Each crossing came faster than the last.
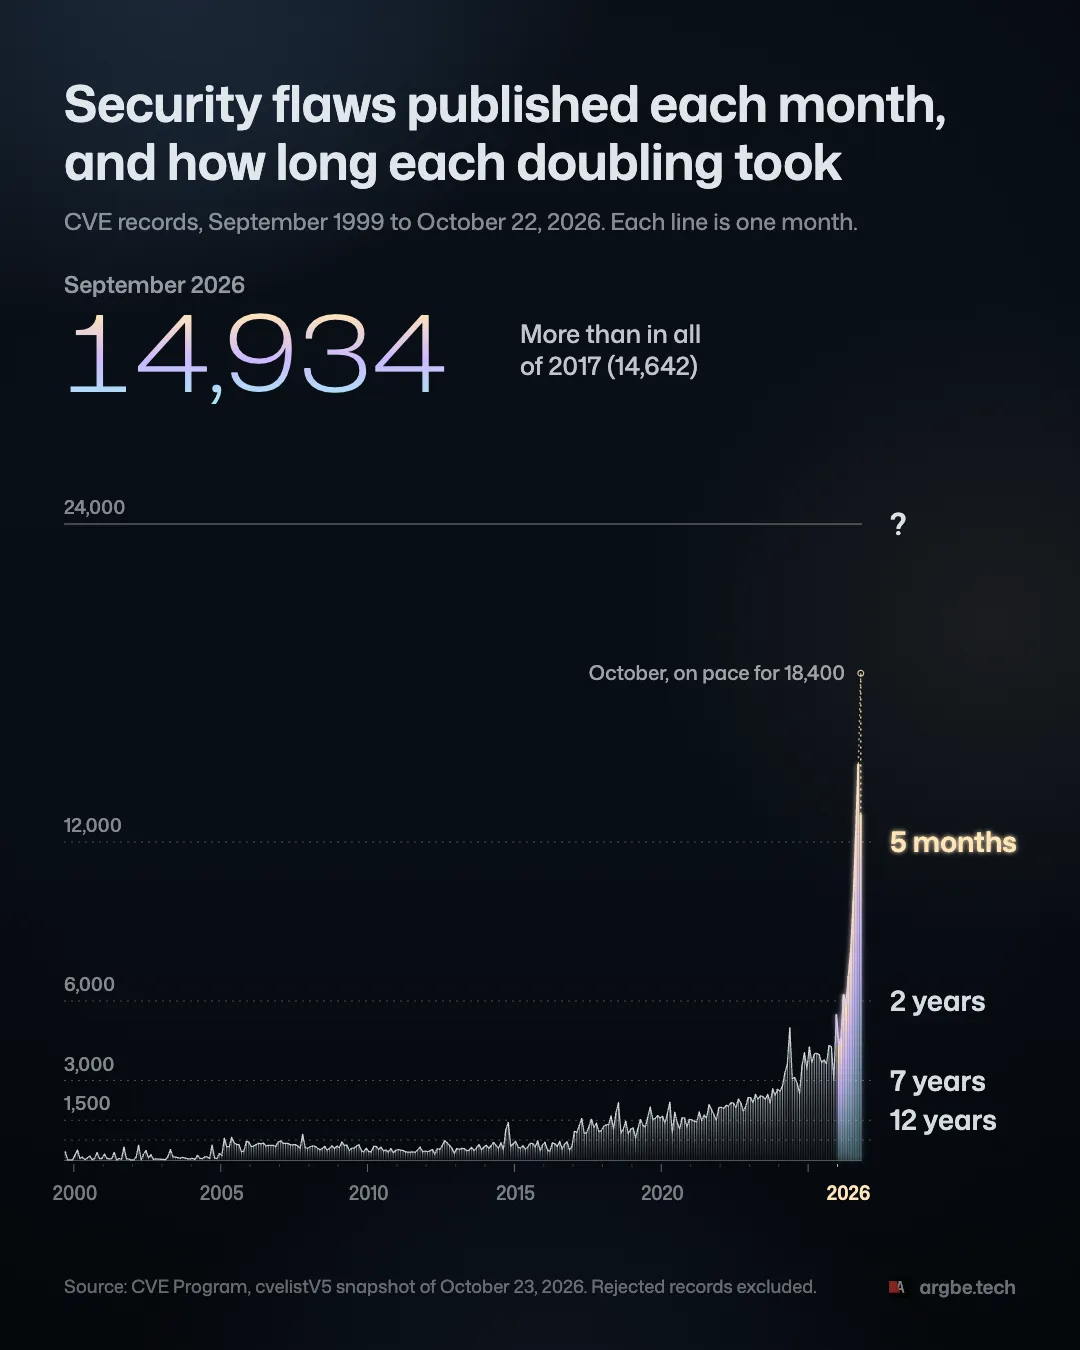
| Level | First month above it | CVEs that month | Time since the last level |
|---|---|---|---|
| 750 | February 2005 | 821 | Start |
| 1,500 | April 2017 | 1,568 | 12 years |
| 3,000 | March 2024 | 3,299 | 7 years |
| 6,000 | March 2026 | 6,236 | 2 years |
| 12,000 | August 2026 | 12,260 | 5 months |
September 2026 alone had 14,934 new CVEs. That’s more than all of 2017, which had 14,642. The count comes from the CVE Program’s snapshot of October 23, 2026. Rejected records are left out.
So these CVE statistics measure publication volume. They don’t count new bugs. The date is datePublished in the CVE record format: when the record entered the list. A record published today can describe a flaw found years ago.
How solid is the pattern?
It depends on the starting level. I picked 750. Starting at 800 or 900 gives roughly the same shape, but not the same timings. The last step takes 3 or 4 months instead of 5. Starting at 500 or 1,000 breaks the pattern. The climb from 2014 to 2018 took under 4 years. The next one took almost 6 (CVE list).
The date field matters too. Group the same records by reservation date instead. Then the third step is no faster than the second (CVE list).
A smoother check agrees on the direction. Twelve-month rolling totals crossed 5,000, 10,000, 20,000, 40,000 and 80,000. The gaps between those crossings were 11.9, 4.5, 3.1 and 1.7 years (CVE list).
So the ladder describes this list, counted this way. It’s not a law. It doesn’t say when the next level comes.
Why the count is rising
In June, FIRST raised its 2026 forecast to about 66,000 CVEs (FIRST). Its February median had been 59,427. FIRST named AI-assisted discovery as one driver. It also named changes in reporting, and CNAs working through backlogs. A CNA is an organization allowed to assign CVE IDs.
My count passed 66,000 on September 16. By October 22 it was at 85,838 (CVE list). October 1–22 added 13,036 CVEs. Keeping that daily average would put October near 18,400. That’s an extrapolation.
AI is part of why. Google’s threat intelligence team (GTIG) says AI is measurably changing how fast vulnerabilities are found (GTIG). It also compared risk. Half its likely AI-found vulnerabilities could allow remote code execution. That compares with 26% in its non-AI group. Those figures cover January to August 2026. The AI label is GTIG’s own heuristic.
Some of the rise is bookkeeping. Kernel.org became a CNA in February 2024 (CVE Program). Its policy leans toward assigning a CVE to fixes that could be security-relevant (kernel.org). That happens automatically once the fix reaches a stable tree. Not every commit gets one. GTIG counted about 5,000 CVEs from January to August whose descriptions mention the Linux kernel. It names automated CNA policies as one source of the inflation.
Backlogs come in bursts. When old findings get published together, the month spikes. That spike isn’t new bugs.
This count can’t say how much of the rise each cause explains.
What it means for patching
In April, NIST changed how its National Vulnerability Database (NVD) works (NIST). Since April 15, it enriches three groups first. Enriching means adding its own analysis. They are CVEs in CISA’s Known Exploited Vulnerabilities (KEV) catalog, software the federal government uses, and critical software under Executive Order 14028. Those are categories, not a severity cutoff. Other CVEs stay listed. New ones are marked “Lowest Priority - not scheduled for immediate enrichment.” You can still request enrichment.
Only about 1 in 431 of this year’s CVEs had been seen exploited by August (GTIG). That’s GTIG’s figure: 0.23% of 2026 disclosures, January to August. It counts the exploitation GTIG observed. It isn’t a lifetime probability.
This part is my opinion. Finding bugs got cheap. Fixing them didn’t. Patching everything is no longer a plan. That’s no reason to skip routine updates. It’s a reason to decide what comes first.
How to decide what to patch first
If you run or ship software, the global count isn’t your queue. The public guidance supports an order like this:
- Start with what you actually run. A CVE in a package you don’t deploy isn’t on your list.
- Known exploitation first. CISA’s KEV catalog lists vulnerabilities known to be exploited in the wild. Its feed had 1,754 entries on October 21. It isn’t complete.
- EPSS for likelihood. FIRST’s EPSS gives a probability from 0 to 1. It estimates observed exploitation in the wild over the next 30 days. Version 5 has run since June 15, 2026 (FIRST). Scores update daily. A score isn’t the chance your system gets breached. A percentile isn’t the probability. A low score never overrules known exploitation.
- SSVC for context. CISA’s SSVC is a decision tree. It weighs exploitation, technical impact, automatability, mission prevalence and public well-being. It ends in Track, Track*, Attend or Act. Even Track means fixing within your normal update cycle.
- CVSS severity as one input. FIRST’s CVSS v4.0 FAQ says base scores describe technical severity. They shouldn’t set patch priority on their own.
Published CVEs by year
The same count, by year of publication. The 2026 row runs through October 22 (CVE list). The 1999 row is the first CVE list, from September 29, 1999. One of its records was rejected later (CVE Program). Early years reflect how the catalog was built. Compare them with care.
| Year | Published CVEs |
|---|---|
| 1999 | 320 |
| 2000 | 1,437 |
| 2001 | 1,323 |
| 2002 | 1,690 |
| 2003 | 1,223 |
| 2004 | 1,612 |
| 2005 | 6,708 |
| 2006 | 6,885 |
| 2007 | 7,211 |
| 2008 | 5,673 |
| 2009 | 5,732 |
| 2010 | 4,639 |
| 2011 | 4,150 |
| 2012 | 5,288 |
| 2013 | 5,187 |
| 2014 | 7,928 |
| 2015 | 6,494 |
| 2016 | 6,457 |
| 2017 | 14,642 |
| 2018 | 16,510 |
| 2019 | 17,308 |
| 2020 | 18,363 |
| 2021 | 20,177 |
| 2022 | 24,999 |
| 2023 | 28,847 |
| 2024 | 39,924 |
| 2025 | 48,151 |
| 2026, to October 22 | 85,838 |
Count it yourself
Here’s how to check my numbers. Download 2026-10-23_all_CVEs_at_midnight.zip.zip from the release. It’s a zip with one zip inside. The script extracts the inner zip, about 710 MB, to a temporary folder. Then it reads every record. It uses only Python’s standard library.
# count_cves.py: published CVE records per month, from a cvelistV5 release asset.
# Usage: python3 count_cves.py ASSET.zip.zip [CUTOFF]
import collections
import json
import sys
import tempfile
import zipfile

asset = sys.argv[1]
cutoff = sys.argv[2] if len(sys.argv) > 2 else "9999"  # e.g. 2026-10-23 skips that day on

per_month = collections.Counter()
with tempfile.TemporaryDirectory() as tmp:
    # The asset is a zip with one zip inside. Extract the inner one first.
    with zipfile.ZipFile(asset) as outer:
        inner = outer.extract(outer.namelist()[0], tmp)
    with zipfile.ZipFile(inner) as records:
        for name in records.namelist():
            if not name.rsplit("/", 1)[-1].startswith("CVE-"):
                continue  # folders, delta.json and deltaLog.json
            meta = json.loads(records.read(name))["cveMetadata"]
            # ISO timestamps sort as text, so a string comparison works.
            if meta["state"] == "PUBLISHED" and meta["datePublished"] < cutoff:
                per_month[meta["datePublished"][:7]] += 1

for month, count in sorted(per_month.items()):
    print(month, count)

# The doubling ladder: the first month above each level, starting at 750.
level = 750
for month, count in sorted(per_month.items()):
    while count > level:
        print(f"Above {level:,}: {month} ({count:,})")
        level *= 2
Pass a cutoff date to leave out the snapshot day’s own records:
python3 count_cves.py 2026-10-23_all_CVEs_at_midnight.zip.zip 2026-10-23 > counts.txt
grep '^2026-09 ' counts.txt                         # 2026-09 14934
awk '/^2026/ {s += $2} END {print s}' counts.txt    # 85838
tail -5 counts.txt                                  # the ladder, from Above 750: 2005-02 (821)
Without the cutoff, October shows 13,040. The extra four were published early on October 23 (CVE list).
NVD keeps its own database. Its API gives a quick cross-check for one month:
curl -s 'https://services.nvd.nist.gov/rest/json/cves/2.0?pubStartDate=2026-09-01T00:00:00.000&pubEndDate=2026-09-30T23:59:59.999&noRejected&resultsPerPage=1' \
  | python3 -c 'import json, sys; print(json.load(sys.stdin)["totalResults"])'
On October 23, NVD returned 14,933 for September (NVD API). In three months checked, its counts differed from the CVE list by up to two records. A later snapshot will differ a little too. Records get rejected, and dates get corrected (CVE Program README).
On this page